What a Risk Score Represents
What a risk score represents
A risk score is often treated like a label—low, moderate, or high. But that is not really what the score means. A risk score does not tell you exactly what will happen to one person. It tells you what tends to happen among people with similar scores.
Risk scores are group-level probabilities, not exact predictions.
The Common Misunderstanding
Risk scores are often treated as fixed categories. But they are better understood as positions along a continuum.
How Risk Scores Usually Look
Scores tend to form a distribution that looks like a bell curve. Most people cluster in the middle, with fewer at the extremes.
Risk scores form a distribution
Most people cluster in the middle of the score range, with fewer at the low and high ends. Each part of this distribution is associated with a different observed outcome rate.
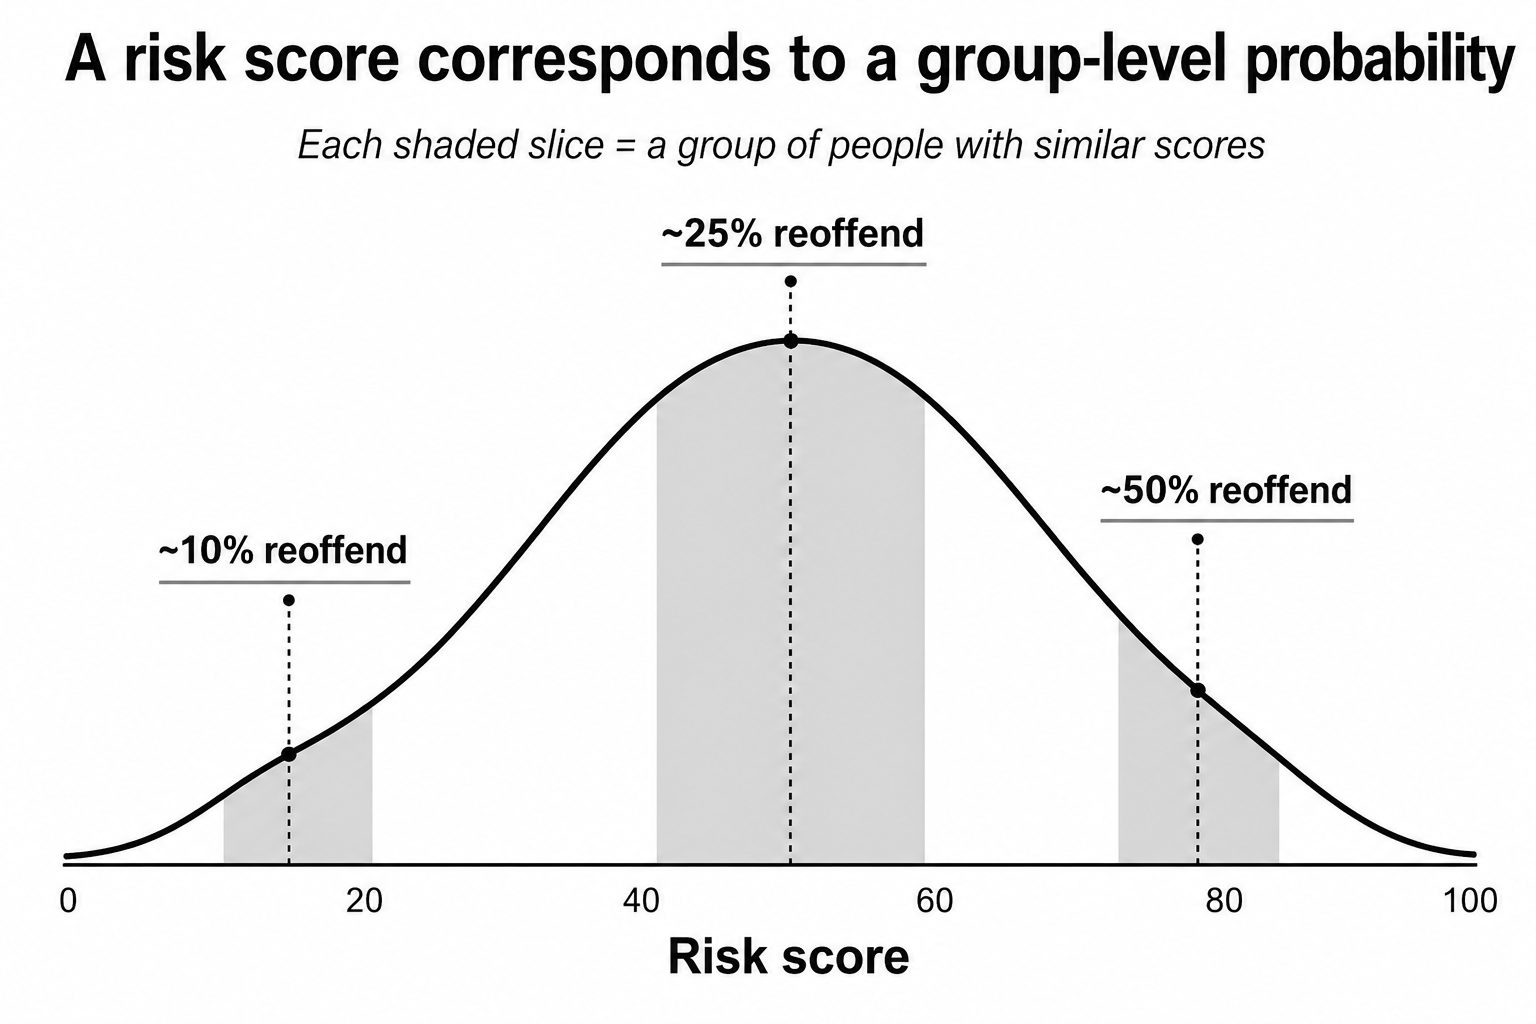
The score places a person within this distribution—linking them to what tends to happen among others with similar scores.
How to Read the Figure
- Lower scores → lower outcome rates (~10%)
- Middle scores → moderate rates (~25%)
- Higher scores → higher rates (~50%)
The score does not predict an individual outcome. It tells you what tends to happen among people with similar scores.
Bottom Line
Risk scores are group-level probabilities—not exact predictions.
Zachary Hamilton
Professor
My research centers on innovation in risk and needs assessment development.